What If Your Event Space Could Tell You How People Actually Behaved?
How spatial analytics is helping brands better understand visitor movement, engagement, and interaction within exhibitions and activations
8 min read | Experiential Marketing | Exhibition Strategy | ROI & Analytics
Most exhibitors can tell when a stand feels busy. What’s much harder to determine in real time is whether visitors are genuinely engaging with the environment or simply moving through the space as part of broader floor traffic.
As exhibition and activation budgets continue to grow, marketing teams are under increasing pressure to demonstrate measurable outcomes from live experiences. Lead scans and post-event feedback still matter, but they rarely explain how attendees actually interacted with the space itself.
Spatial analytics is helping change that by giving brands clearer visibility into movement, engagement, dwell time, repeat visitation, and behavioural performance across exhibition environments.

Key Takeaways
- • High foot traffic doesn’t always mean strong engagement
- • Dwell time is becoming an important exhibition KPI
- • Spatial analytics reveals how visitors actually move through a stand
- • Behavioural data helps improve future exhibition ROI
- • Brands can identify which stand zones genuinely perform
By the Numbers
Busy Doesn’t Always Mean Effective
For years, exhibition performance has largely been judged by visibility. If a stand looked crowded, attracted attention, or generated a strong flow of visitors throughout the day, it was generally considered successful.
The issue is that visibility and engagement aren’t necessarily the same thing.
Some stands benefit from strong positioning within the exhibition floorplan and naturally receive heavy passerby traffic regardless of how effectively the environment itself functions. Others may experience lower overall traffic while generating significantly stronger interaction rates because the space encourages people to stop, explore, and spend time there rather than simply walking through it.
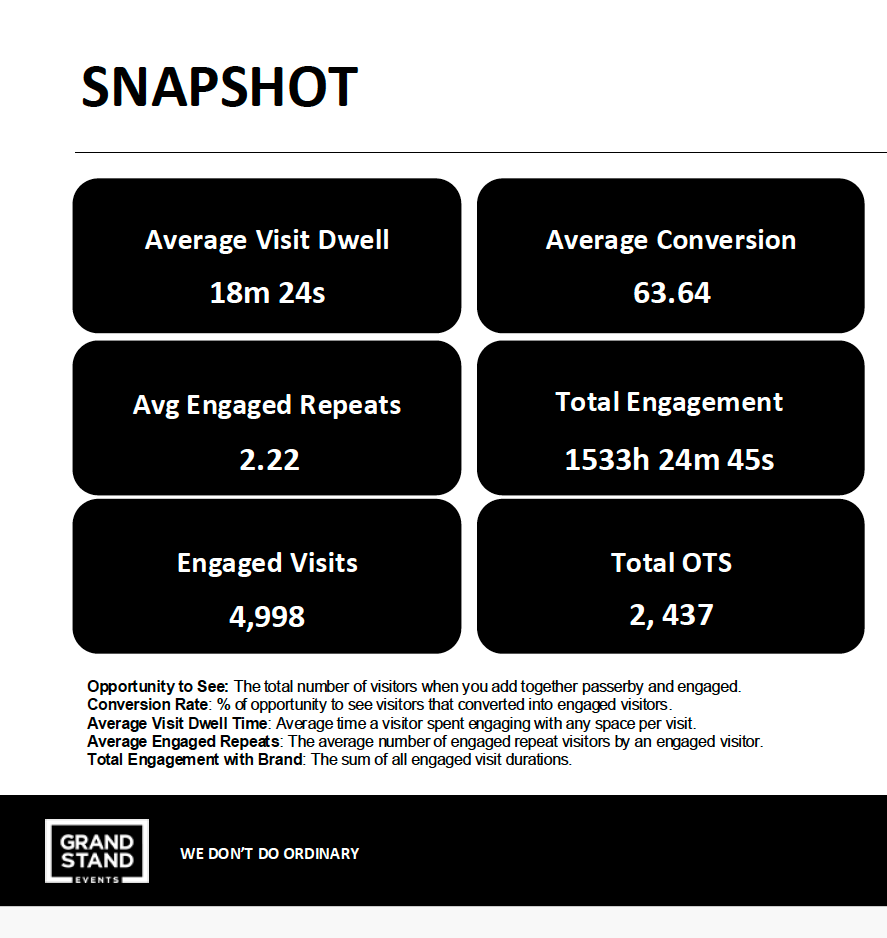
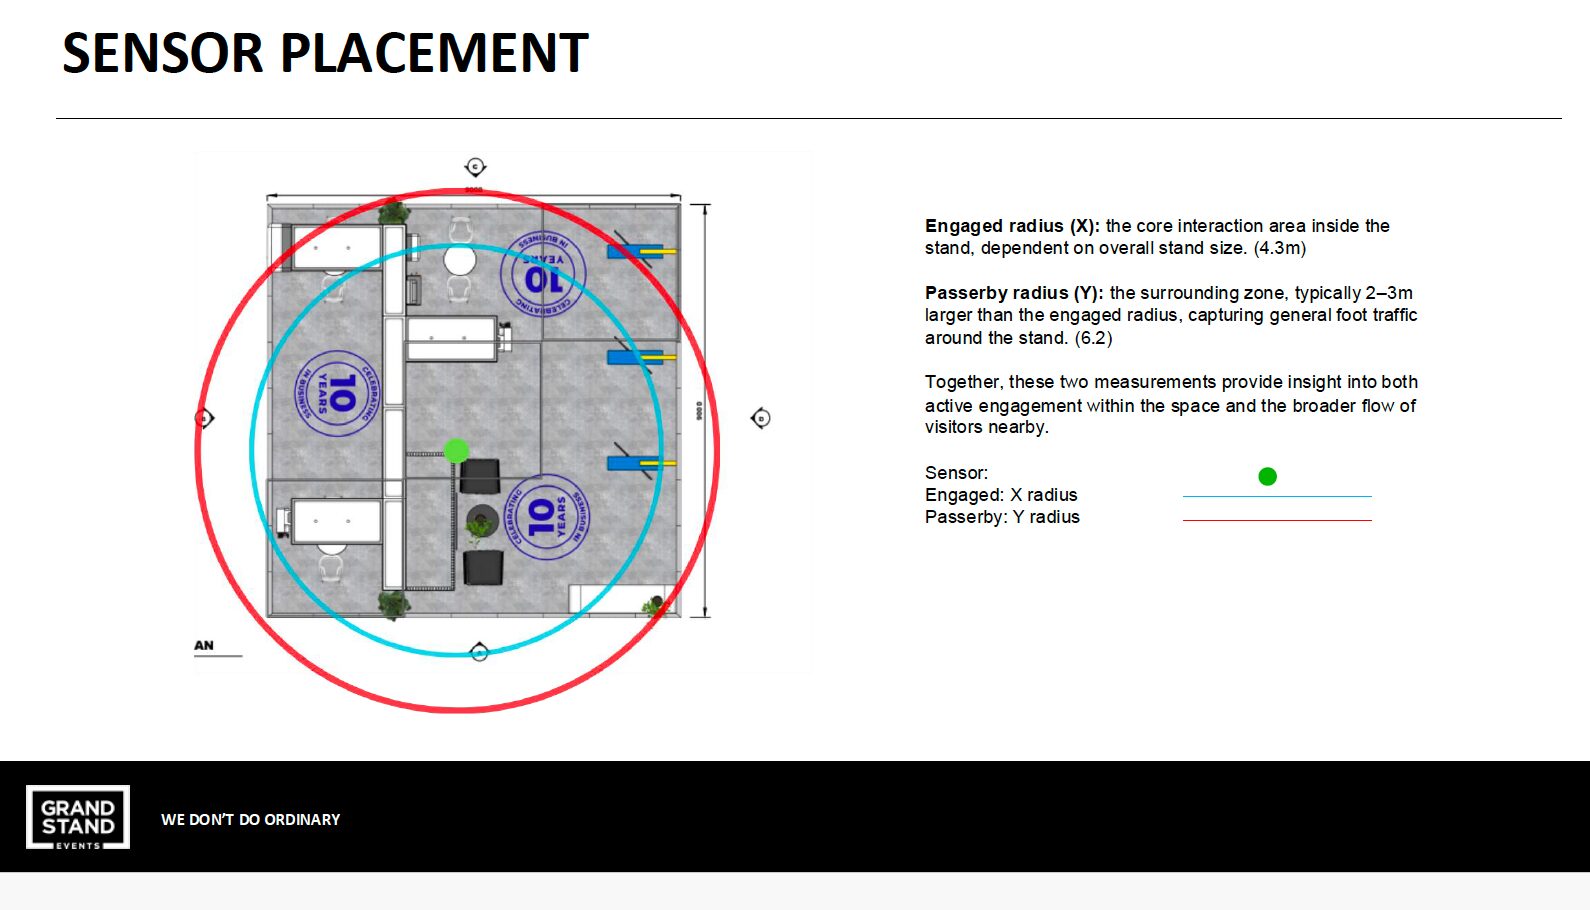
At Smart Energy 2026, Grand Stand Events implemented spatial analytics across the Go Solar space to better understand how attendees interacted with the stand throughout the two-day event. The analytics recorded more than 2,400 opportunities to see, alongside an engagement conversion rate exceeding 63%.
The dwell data told an even stronger story. Visitors spent an average of more than 18 minutes engaged within the environment, while nearly half of all engaged visitors remained inside the stand for longer than 10 minutes.
In exhibition terms, that’s a strong result. Longer dwell time is widely recognised as a strong indicator of deeper visitor engagement and increased opportunity for meaningful interaction. Industry research consistently shows that interactive and experience-led environments encourage attendees to spend more time within a space, improving engagement quality, brand recall, and conversion potential.
“Busy exhibition spaces don’t always produce meaningful engagement. In many cases, the strongest interactions happen when visitors feel comfortable slowing down and spending time within the environment.”
What Spatial Analytics Actually Reveals
One of the more valuable aspects of exhibition analytics is the ability to identify behavioural trends that are often difficult to recognise while the event is taking place.
During a live show, staff are naturally focused on conversations, presentations, demonstrations, hospitality, and lead generation. Although experienced exhibitors usually develop a general sense of how the stand is performing, many behavioural patterns only become obvious once the data is reviewed afterwards.
Interestingly, the data often challenges assumptions.
One trend we’ve seen across multiple events is that high traffic periods do not always produce the strongest engagement outcomes. In some cases, heavily congested aisles can reduce meaningful interaction because visitors feel pressured to continue moving rather than stopping comfortably within the space.
At Go Solar’s Smart Energy stand, Day 1 generated significantly higher overall traffic volumes, yet Day 2 delivered stronger sustained engagement throughout the afternoon despite lower attendance.
Why Dwell Time Matters More Than Most Brands Realise
As experiential marketing becomes more sophisticated, dwell time is emerging as one of the clearest indicators of engagement quality.
Put simply, dwell time measures how long visitors voluntarily remain engaged within an environment. Longer dwell periods generally suggest stronger interaction, greater interest, and more meaningful brand exposure.
This becomes particularly important within exhibition environments where attendees are constantly competing for time and attention across hundreds of surrounding exhibitors.
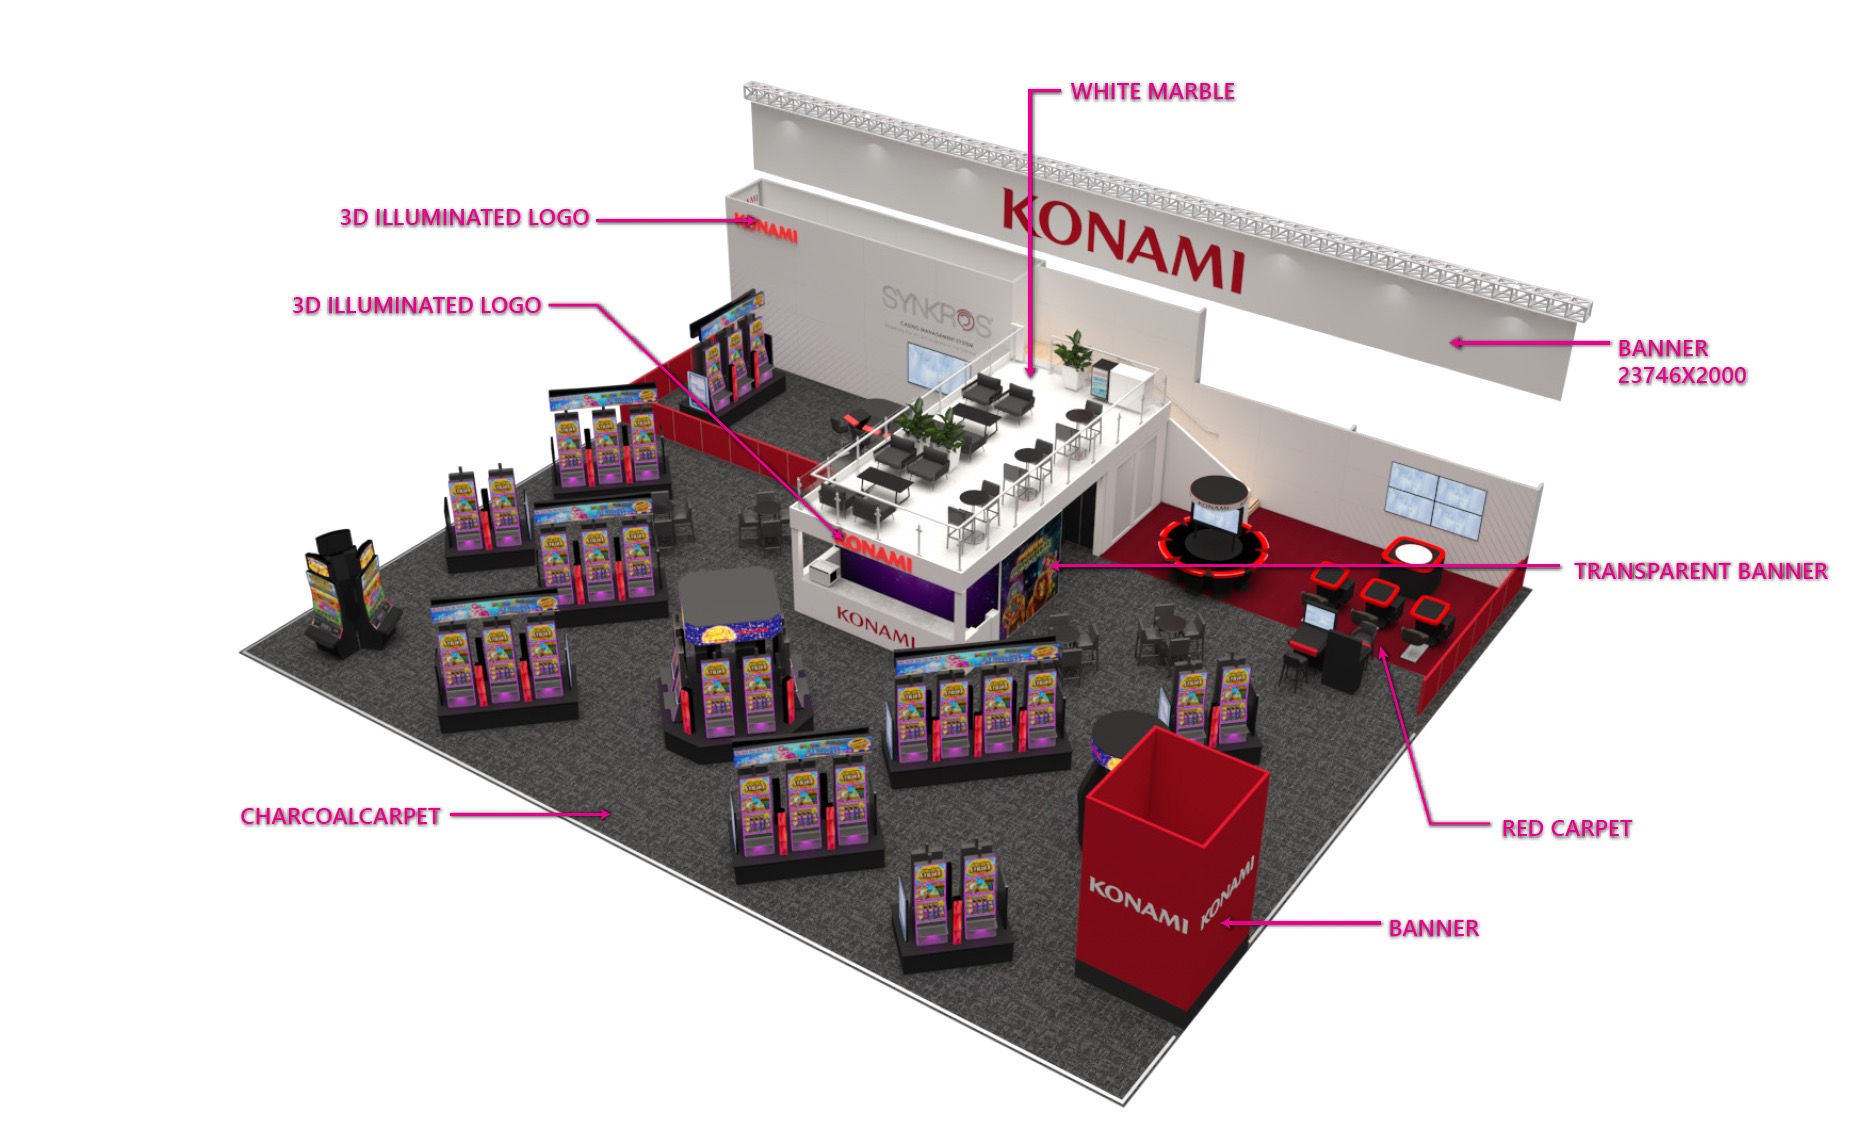
At Konami’s AGE 2025 space, spatial analytics revealed an average engaged visit duration of more than 17 minutes, alongside almost 1,000 hours of total engagement across the three-day event.
The reporting also highlighted strong repeat visitation throughout the show. More than 200 attendees returned across all three event days, while engagement conversion rates improved progressively as the activation continued.
That kind of repeat visitation is difficult to fake. It usually means the environment created enough interest or value for attendees to actively seek it out again later in the event rather than simply encountering it while walking the floor.
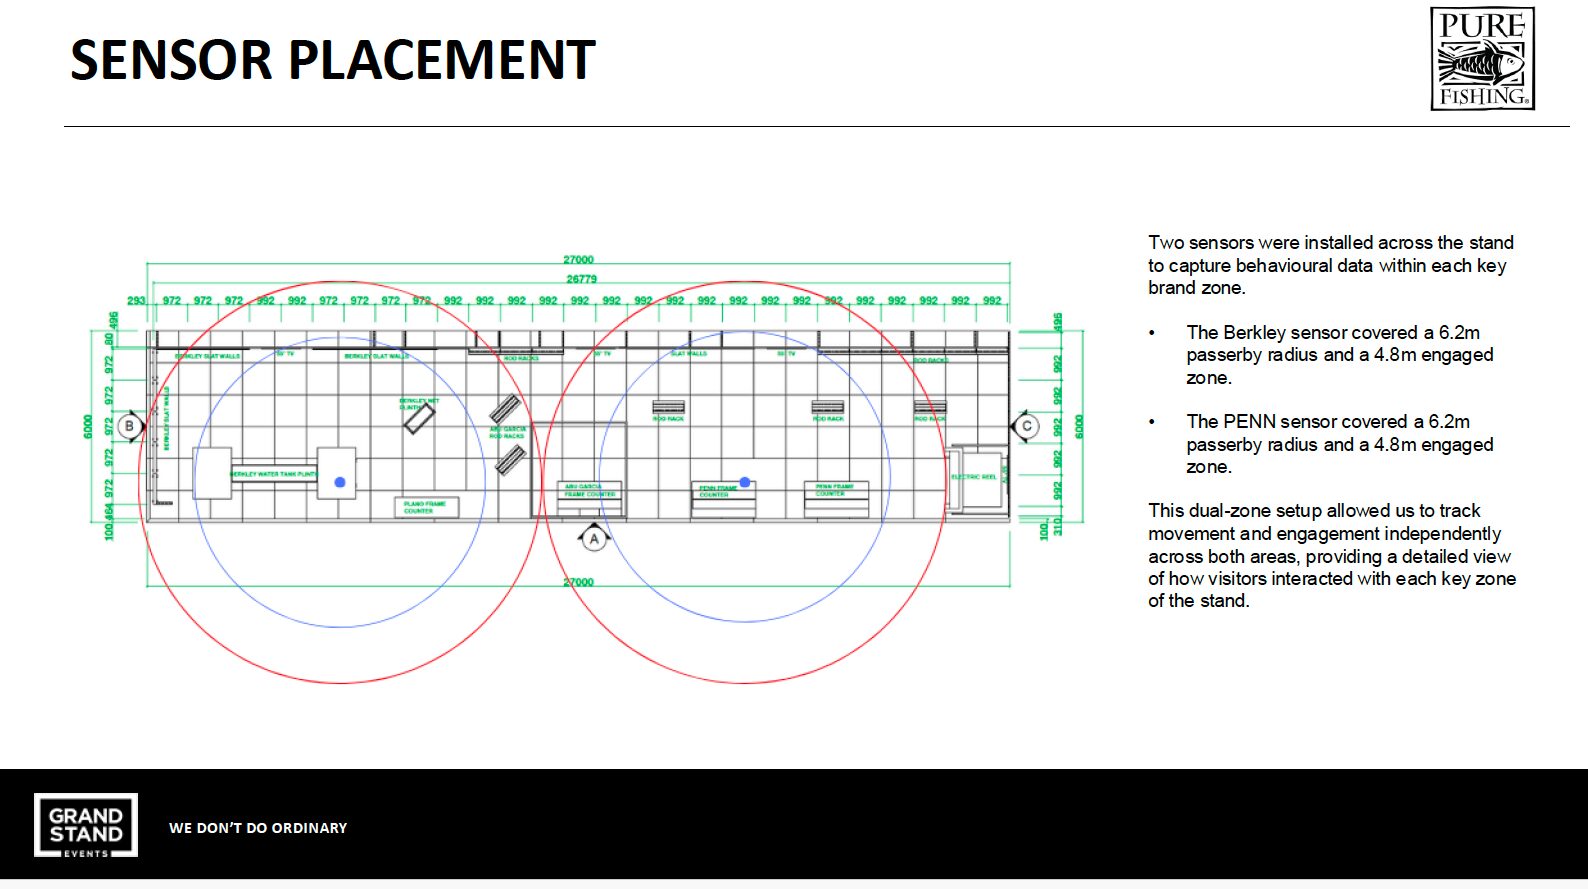
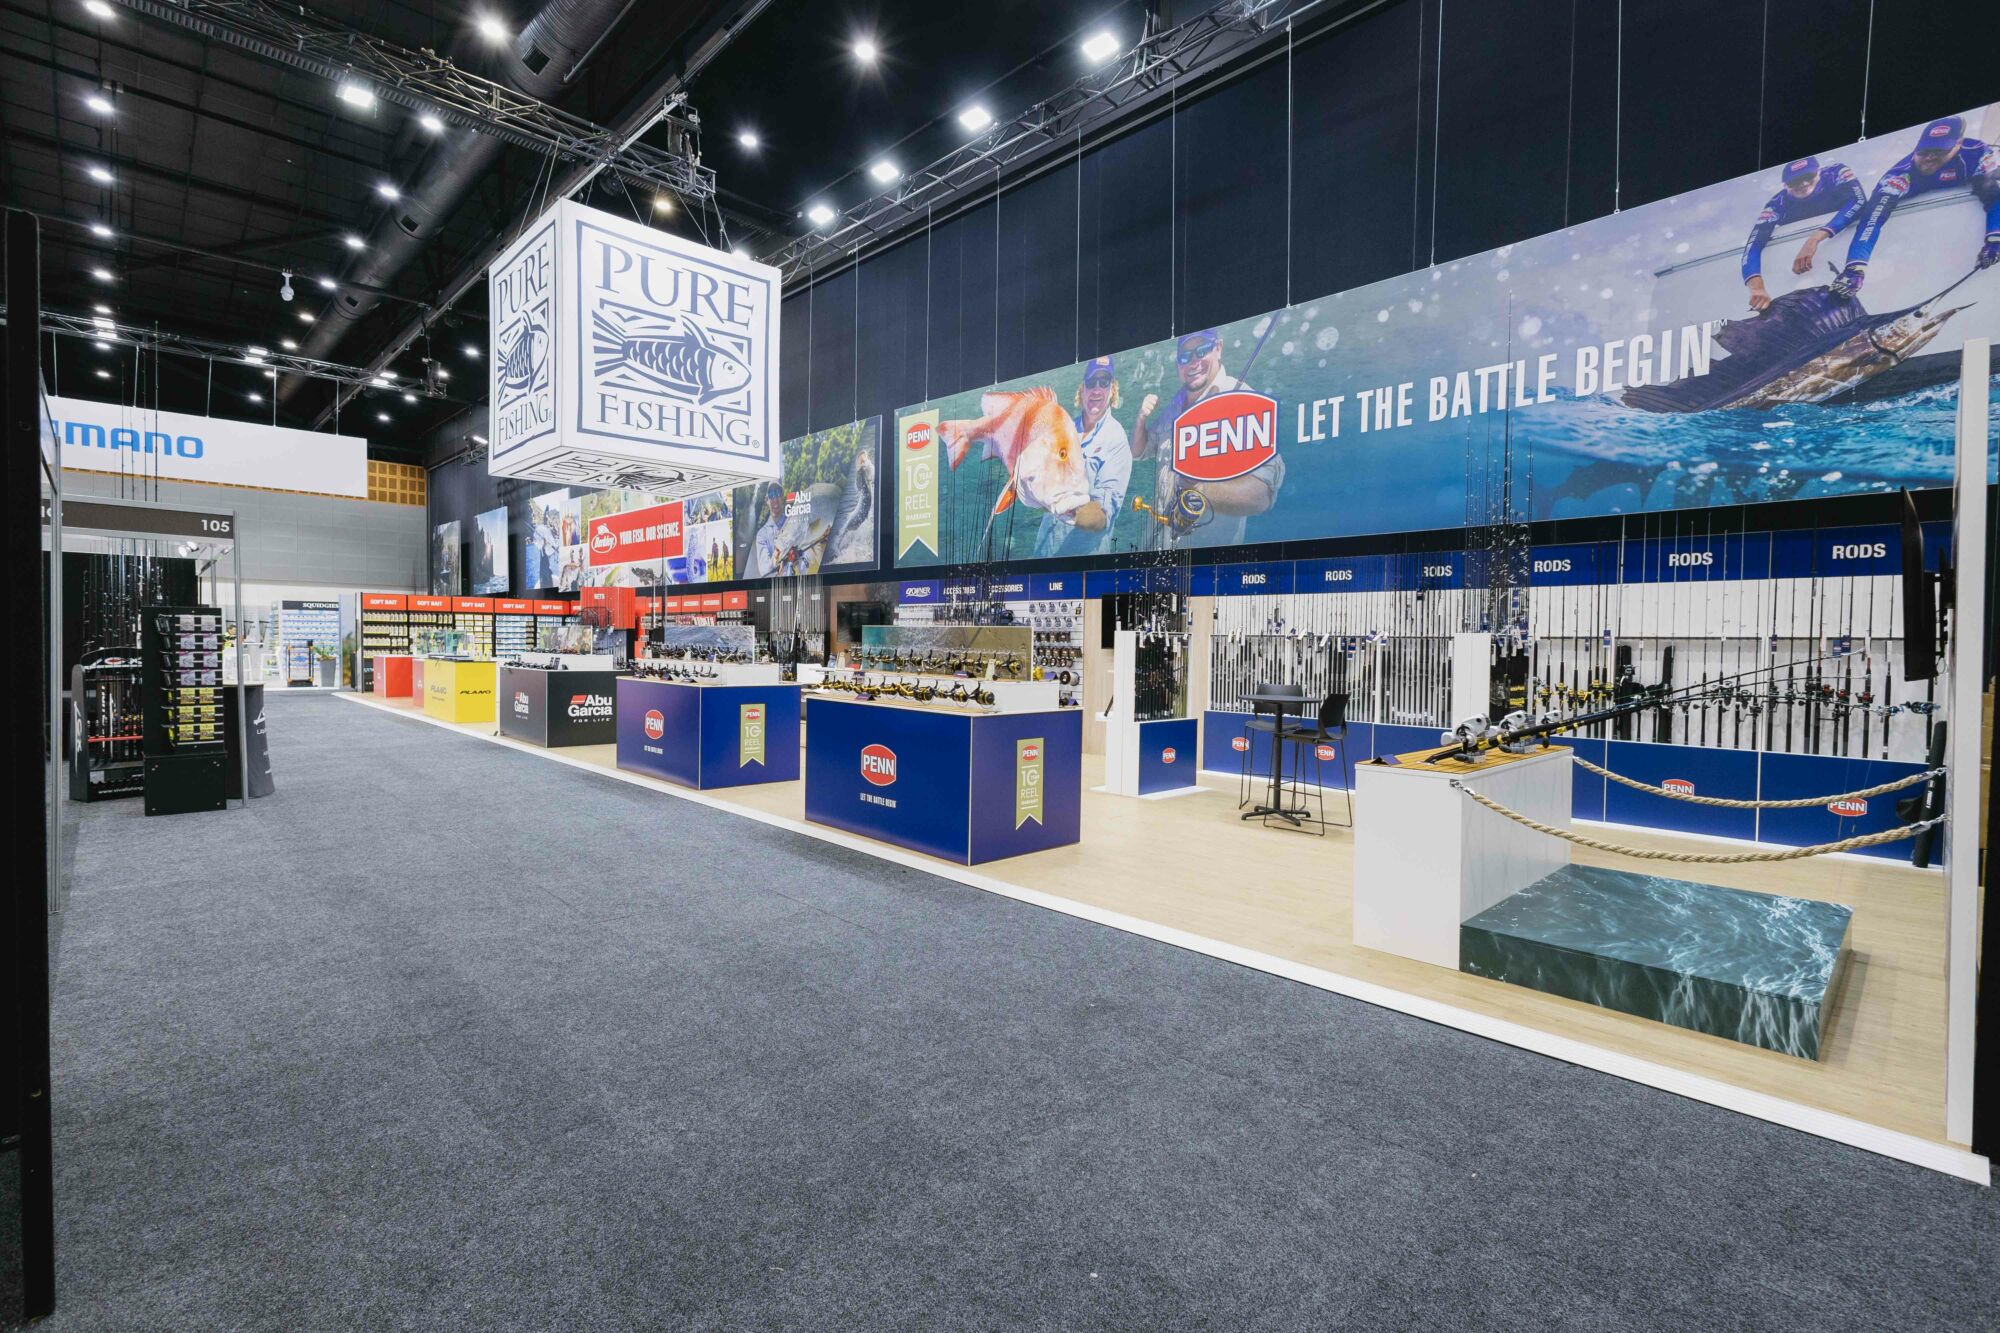
Mini Case Study: Pure Fishing at AFTA 2025
Key Insight:
Behavioural analytics helps brands move beyond assumptions and properly evaluate how layout, staffing, visibility, product interaction, and stand flow influence engagement outcomes.
How Brands Are Using Analytics After Events
One of the biggest misconceptions around exhibition analytics is that the reporting only matters once the event has already finished.
In reality, the long-term value comes from how the information is used afterwards.
At the Brisbane Truck Show 2025, spatial analytics reporting identified clear engagement peaks during midday periods across multiple event days.
Insights like these can directly influence future operational planning. Brands can better align demonstrations, presentations, staffing levels, and key interactions with the periods where engagement quality is strongest.
“The most valuable part of behavioural analytics isn’t the reporting itself. It’s the ability to make smarter exhibition decisions the next time around.”
Understanding ROI Beyond Lead Numbers
One of the biggest challenges in experiential marketing has always been proving value beyond surface-level metrics.
Lead scans and business cards only tell part of the story. They rarely capture how attendees interacted with the environment itself, how long they remained engaged, or whether the activation genuinely held attention in a meaningful way.
For many marketing teams, that creates a difficult reporting challenge internally. Exhibition budgets are often substantial, particularly for large custom builds, activations, sponsorships, and multi-day trade shows.
At Go Solar’s Smart Energy 2026 activation, visitors generated more than 1,500 hours of total brand engagement across the two-day event.
For marketers, that creates a far more meaningful understanding of exhibition value than raw traffic numbers alone.
It also helps identify where investment is performing well and where future activations may need refinement.
Exhibitions Are Becoming Increasingly Accountable
Experiential marketing has always been effective because of its ability to create genuine human interaction. What’s changing now is the level of visibility brands have into how those interactions actually occur within physical space.
As exhibition investment continues increasing, marketing teams are being asked more frequently to demonstrate not only attendance outcomes, but engagement quality and behavioural performance as well.
Spatial analytics provides another layer of understanding that helps bridge the gap between creative execution and measurable strategy. It allows brands to evaluate how effectively an environment encouraged interaction, sustained visitor attention, and supported meaningful engagement over time.
Strong exhibition environments have always been about more than visual impact alone. The most effective spaces are carefully structured to encourage movement, reduce friction, create moments of pause, and support natural interaction between attendees and brand representatives.
At Grand Stand Events, we see spatial analytics as part of a broader shift toward smarter, more strategically informed experiential design. As exhibitions continue evolving, the ability to understand how people genuinely move, engage, and interact within a space will become increasingly valuable for brands looking to maximise the return on their event investment.
Want Better Visibility Into Exhibition ROI?
Spatial analytics is helping brands better understand how visitors engage with exhibition environments in real time. From dwell time and repeat visitation through to engagement quality and zone performance, behavioural data is becoming an increasingly valuable part of exhibition strategy.
Talk to Grand Stand Events about integrating analytics into your next activation.

BRANDS WE’VE MADE STAND OUT